Reading Bounce Rate on Google Analytic will make you understand how your visitors surfing. Because this data will help you in increasing traffic. Because of that, on this article, we will share to you how to read Bounce Rate on Google Analytic. Previously, you should understand about "session" on Google Analytic. Session in Google Analityc is counting when:
1. More than 30 minutes have elapsed between pageviews for a single visitor.
2. At the end of a day.
3. When a visitor closes their browser.
Before we talk more, this article is not for people who have big business, but this is the first practice to understand how to enhance your blog business, at least.
Also, before we talk more again, you should to know about PAGEVIEW. A pageview is an instance of a page being loaded by a browser. The pageviews metric is the total number of pages viewed; repeated views of a single page are also counted. In fact, for business, pageview is useless, because we don't know the different between total number of pages viewed with repeated views of a single page. However, if you implementing ads on your blog, some of third parties ads, will see your pageview when they reviewing your site.
Another side, bounce rate is the percentage of visits that go only one page before exiting a site. There are number of factors why your visitors are leave from entrance page or leave your blog. Below is factors that influence bounce rate:
1. Single page, fortunately, blog is not designed for single page but blogger has single page facility
2. Your design
3. Your navigation
4. Your explanation on an article
5. Your update
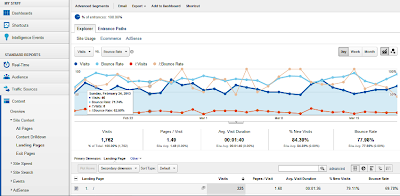
However, if someone bookmarks your blog, then it is one of factor of bounce rate. On our article, social bookmarks are the most source of high bounce rate. Let we practice, Open your Google Analytic -> Content -> Site Content -> Landing Pages. Now choose Explore tab, then make Visits v.s Bounce Rate, so that you will see a data like below
 |
| Landing Pages, Visits v.s Bounce Rate |
Actually, from here you can take a conclusion about bounce rate of your blog. However, for beginner, this is still confusing. So, let we choose one of landing page, let say homepage, the homepage data is labeled by "/", then give check on that. After that, let we plot that by click Plot Rows button, see the image below carefully.
 |
| Landing Pages on homepage |
now, you see 4 graphs: Visits, Bounce Rate, /:Visits, /:Bounce Rate. Remember, "/" is label for homepage. So it is very different between Visits with /:Visits. Where Visits is counted to all pages of the site, but /:Visits is counted just only on homepage.
See the data just only from Landing Pages will not tell you more. So, you need help from Visitors Flow data. Just go to Audience -> Visitors Flow. Now, let we specific date, to see what happen on that date. In here, I give specific date on February 24, 2013. See the image below
 |
| Visitors Flow |
Now, time how to read these datas. First, hover your mouse on Landing Pages plot, of course on February 24. You will see the small box which contain values of visits and bounce on that date, check the image below
We see from that small box, on February 24, there are 46 visits total was came to all pages. And 8 of the visits was came to homepage (labeled by "/"). This small box is also tell that on February 24, there are 71.74% bounce rate total was happened to all pages, and 62.50% bounce rate on homepage.
These datas mean, there are 46 visits = 8 (homepage) + 4 + 3 + 3 + 3 + 25 visits was came to all pages, but 46*(0.7174) = 33 of them was drop offs. Only about 13 visits was continued surfing to other page. The same condition was happen on homepage, about 8 visits was came but 8*(0.6250) = 5 of them was drop offs. Only 3 visits was continued surfing to other page. See the Visitors Flow image above. The different value between 36 drop offs with our calculation (33 drop offs) happen because of how many important number was used in calculation.
When you hover homepage data on Visitors Flow (on starting page), you will see another small box that tell 5 drop offs and 3 Through Traffic. So visits total is 8 visits. See the image below
 |
| Small Box appear when you hover on specific page of Visitors Flow Data. |
Why this happen? because, we are not publish a new article yet. They seldom to open other pages because they was read those before, except they are forget. Wait for our new topic about how to read Google Analytic, we will discuss this as complete as possible.

Post a Comment